Timestamp Visualizer
Overview
SENSR processes data from LiDARs at a set rate (default: 10Hz). To ensure proper processing, SENSR needs to receive LiDAR data within a specific timeframe (1/rate) before processing it. In large installations (due to size or the number of sensors), network inefficiencies can cause delays in the point cloud data. These delays can negatively impact perception quality. To address this, SENSR is equipped with a Timestamp Visualizer that allows users to see when LiDAR data is received across frames.
How to Use the Timestamp Visualizer
- Select Settings > Advanced Features > Timestamp Visualizer.
- A window will appear as described below.
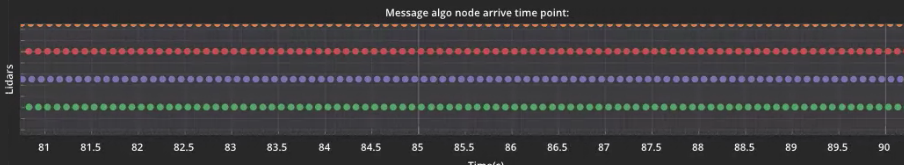
To ensure LiDARs are transmitting their point clouds correctly, verify the following:
- No frames are missing: Points should not be missing in the visualizer.
- Frames are received at the correct frequency: Points should be evenly spaced for each LiDAR.
If either of these conditions is not met, consider the following actions:
If frames are missing:
- The sensors may not be transmitting data continuously. This could be a firmware or device issue.
- The network may be retaining some packets. Check bandwidth availability.
If frames are not received at the correct frequency:
- The sensors may not be transmitting data properly. Test this by connecting a sensor directly to the SENSR host and checking the packet reception frequency.
- Network jitter may be occurring. Verify bandwidth occupancy, network interface ratings, and network policies with your network provider.